Cooling off the hottest & dirtiest places in the region
By Vivek Shandas, August 26 2015
You’ve talked about it with your neighbors over the fence and with friends at the cookout: It’s been a pretty hot summer in the Portland area.
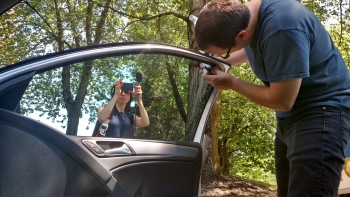 On some of the hottest days, I like to get in the car and drive around with Jackson Voelkel, a geospatial research analyst in my Sustaining Urban Places Research Lab at Portland State University, and Dr. David Sailor, a PSU engineering professor. It’s not just any car. It’s outfitted with sensors and temperature gauges, allowing us to locate in real time the hottest spots in Portland.
We’ve been working with a team for several years to develop heat island maps for Portland and its surrounding region. We’ve also worked with Dr. Linda George and her lab to study traffic-related air quality, and the impact of trees on that air quality. These two environmental measures help us identify the hottest and dirtiest places throughout The Intertwine, and who is particularly at risk for health problems during high-heat events.
![Resource linking the hottest and most [air] polluted places with vulnerable populations. Created by PSU's Sustaining Urban Places Research Lab. Available online to the public soon.](/sites/theintertwine.org/files/resize/pdx-resiliency-map-375x242.png) Last year, we were approached by the PSU Institute for Sustainable Solutions about working with the Portland Bureau of Planning and Sustainability as part of the Portland Climate Action Collaborative. The idea was to take some of our research on heat island and air quality mapping and make it applicable for city officials and public health managers looking for ways to reduce respiratory illness and other negative—potentially fatal—impacts during Portland’s heat waves. We were especially interested in reducing harm to the most vulnerable populations: the elderly, people with asthma, and children and babies.
Last year, we were approached by the PSU Institute for Sustainable Solutions about working with the Portland Bureau of Planning and Sustainability as part of the Portland Climate Action Collaborative. The idea was to take some of our research on heat island and air quality mapping and make it applicable for city officials and public health managers looking for ways to reduce respiratory illness and other negative—potentially fatal—impacts during Portland’s heat waves. We were especially interested in reducing harm to the most vulnerable populations: the elderly, people with asthma, and children and babies.
What many people don’t realize is that there are more deaths attributed to urban heat in the United States than all other natural disasters combined. Evidence from places where hundreds of people have died, including Chicago, St. Louis, and throughout Europe, suggests that many of those deaths occur in populations with preexisting health conditions, but also impact those with fewer financial resources to take measures like installing air conditioning. Combine a hot day with dirty air, and we have a lethal recipe for any urban community, including the Portland region.
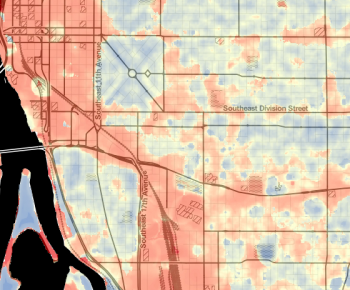 Yet the challenge for public health workers, we learned, is to find the places where heat islands, degraded air quality, and vulnerable populations exist in the same place. At the same time, the challenge for planners is to consider the policy and design options that can cool and clean city neighborhoods.
By layering demographic data on top of our heat island and air quality maps, we’ve been able to uncover the factors that contribute to human vulnerability. It’s no surprise that wealthy neighborhoods with mature trees, such as Irvington in Northeast Portland, Ladd's Adddition in Southeast Portland, and Portland Heights in Southwest Portland, are much better off than lower-income neighborhoods with less greenery, such as Cully in Northeast Portland, Foster-Powell in Southeast Portland, and St. Johns in North Portland. Perhaps surprising is that the same system of inclusion and exclusion of tree-filled neighborhoods has the same results in the 12 other U.S. cities we’ve studied. In other words, the current climate adaptation picture isn’t very equitable.
Approved earlier this summer by Portland City Council and Multnomah County, the 2015 Portland Climate Action Plan includes our layered maps (on page 112). We believe that sharing our timely research with the city and county was a first step in helping us to understand what strategies, programs, infrastructure, and policies need to be put in place to ensure a more equitable approach to climate mitigation in the region.
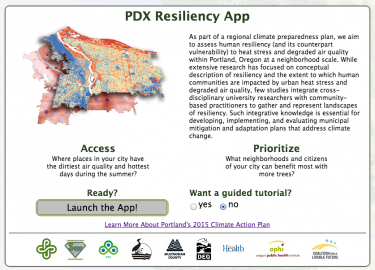 Right now we’re working on an interactive version of the map that will help policy makers and citizen groups drill down on specific Portland streets and neighborhoods to find trouble spots. Notable in our analysis is that trails and greenways factor prominently in reducing air pollution and mitigating urban heat. The more extensive tracts of greenery present in specific areas, the greater cleaning and cooling of the air. Our wish is that such interactive maps will help generate a conversation about areas of the city that need attention, to work with local organizations to bring awareness about environmental conditions, and ultimately to take action to cool and clean the city, one neighborhood at a time.
There are several ways to cut down on heat island effects in urban areas. You can reduce the reflectivity of surfaces, such as changing a black parking lot or rooftop to a lighter color; reduce the amount of connected concrete in a neighborhood; and, of course, plant more and greater continuity of trees. We are in the process of developing an approach that brings together existing information about effective strategies as part of a tailored online mapping tool. We expect to release the tool this winter 2016.
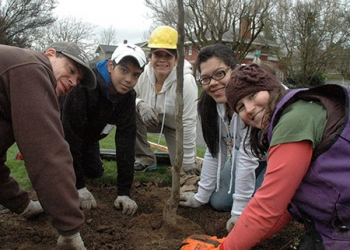 We also want to know where urban tree planting can have the most positive impact. Recently the SUPR Lab released the Trees and Health APP, an online tool that allows anyone to scan city neighborhoods and find the ones most in need of trees. The APP, which stands for Assess, Prioritize and Plan, is part of a U.S. Forest Service-sponsored project named Healthy Trees, Healthy People. So far, the tool is available in 13 cities, including Portland, and we would like to expand it to more. We would welcome members of the Intertwine Alliance to use and evaluate the tool by assessing the extent to which your specific goals align with the current challenges facing the region.
I’m thrilled to see attention being given to the relationship between nature and health, especially the role of trees as part of our healthcare plan. I’m noticing that the health and well-being benefits of urban trees are getting into the mainstream media, and that policy makers and citizen groups are paying attention.
So as you talk to your neighbors and friends about the hot summer, you might also consider asking them about how your neighborhood can accommodate more trees. You might be surprised by their responses!

 Vivek Shandas is an Associate Professor in the Nohad A. Toulan School of Urban Studies and Planning at Portland State University. He's also founder of the
Comments
Thermal Map
I've noticed the same phenomenon in Downtown Portland
Equitable Trees
Tree Removal for Development of Density
Add new comment